Time Remaining ReportsTime remaining report types and preconfigured report charts include: - Select >By Month Report
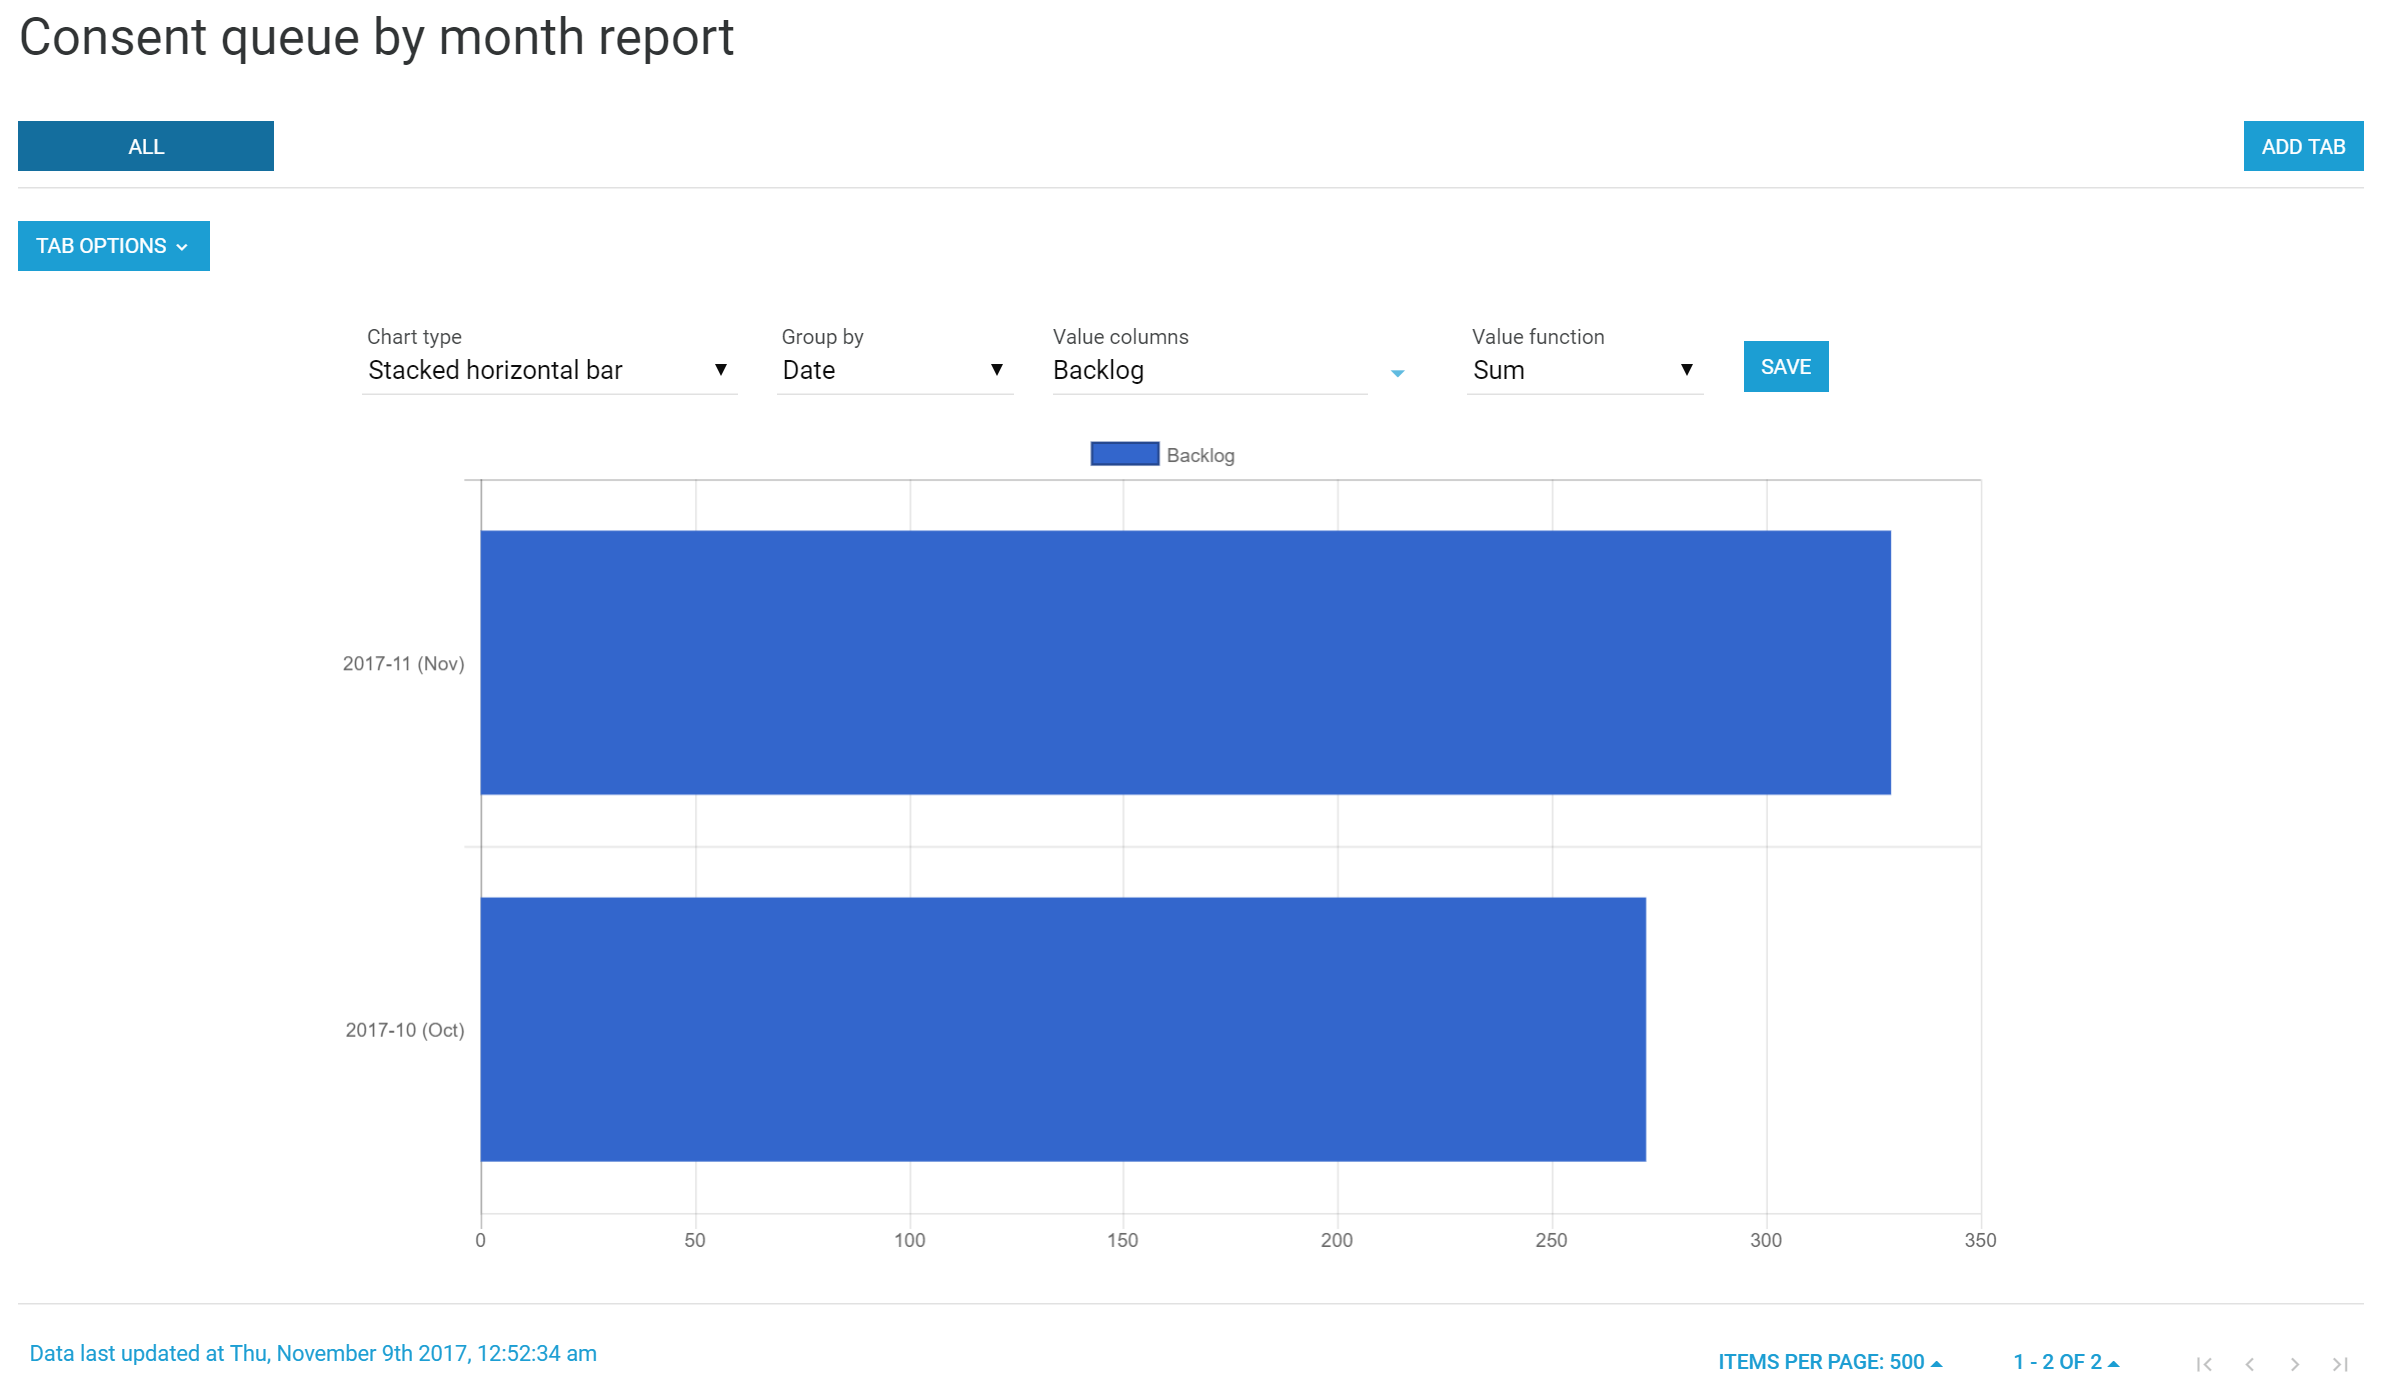
- All: This preconfigured chart displays the number of consents in progress (backlog) at the end of each month (or month to date for the current month) stacked by overdue and not overdue.
- The blue component 'Not overdue' displays the number of consents in progress where the duration (with Road Manager) has not exceeded the maximum duration available for consent (including any extensions of time).
- The red component 'Overdue' displays the number of consents in progress at the end of each month where the duration (with Road Manager) has exceeded the maximum duration available for consent (including any extensions of time).
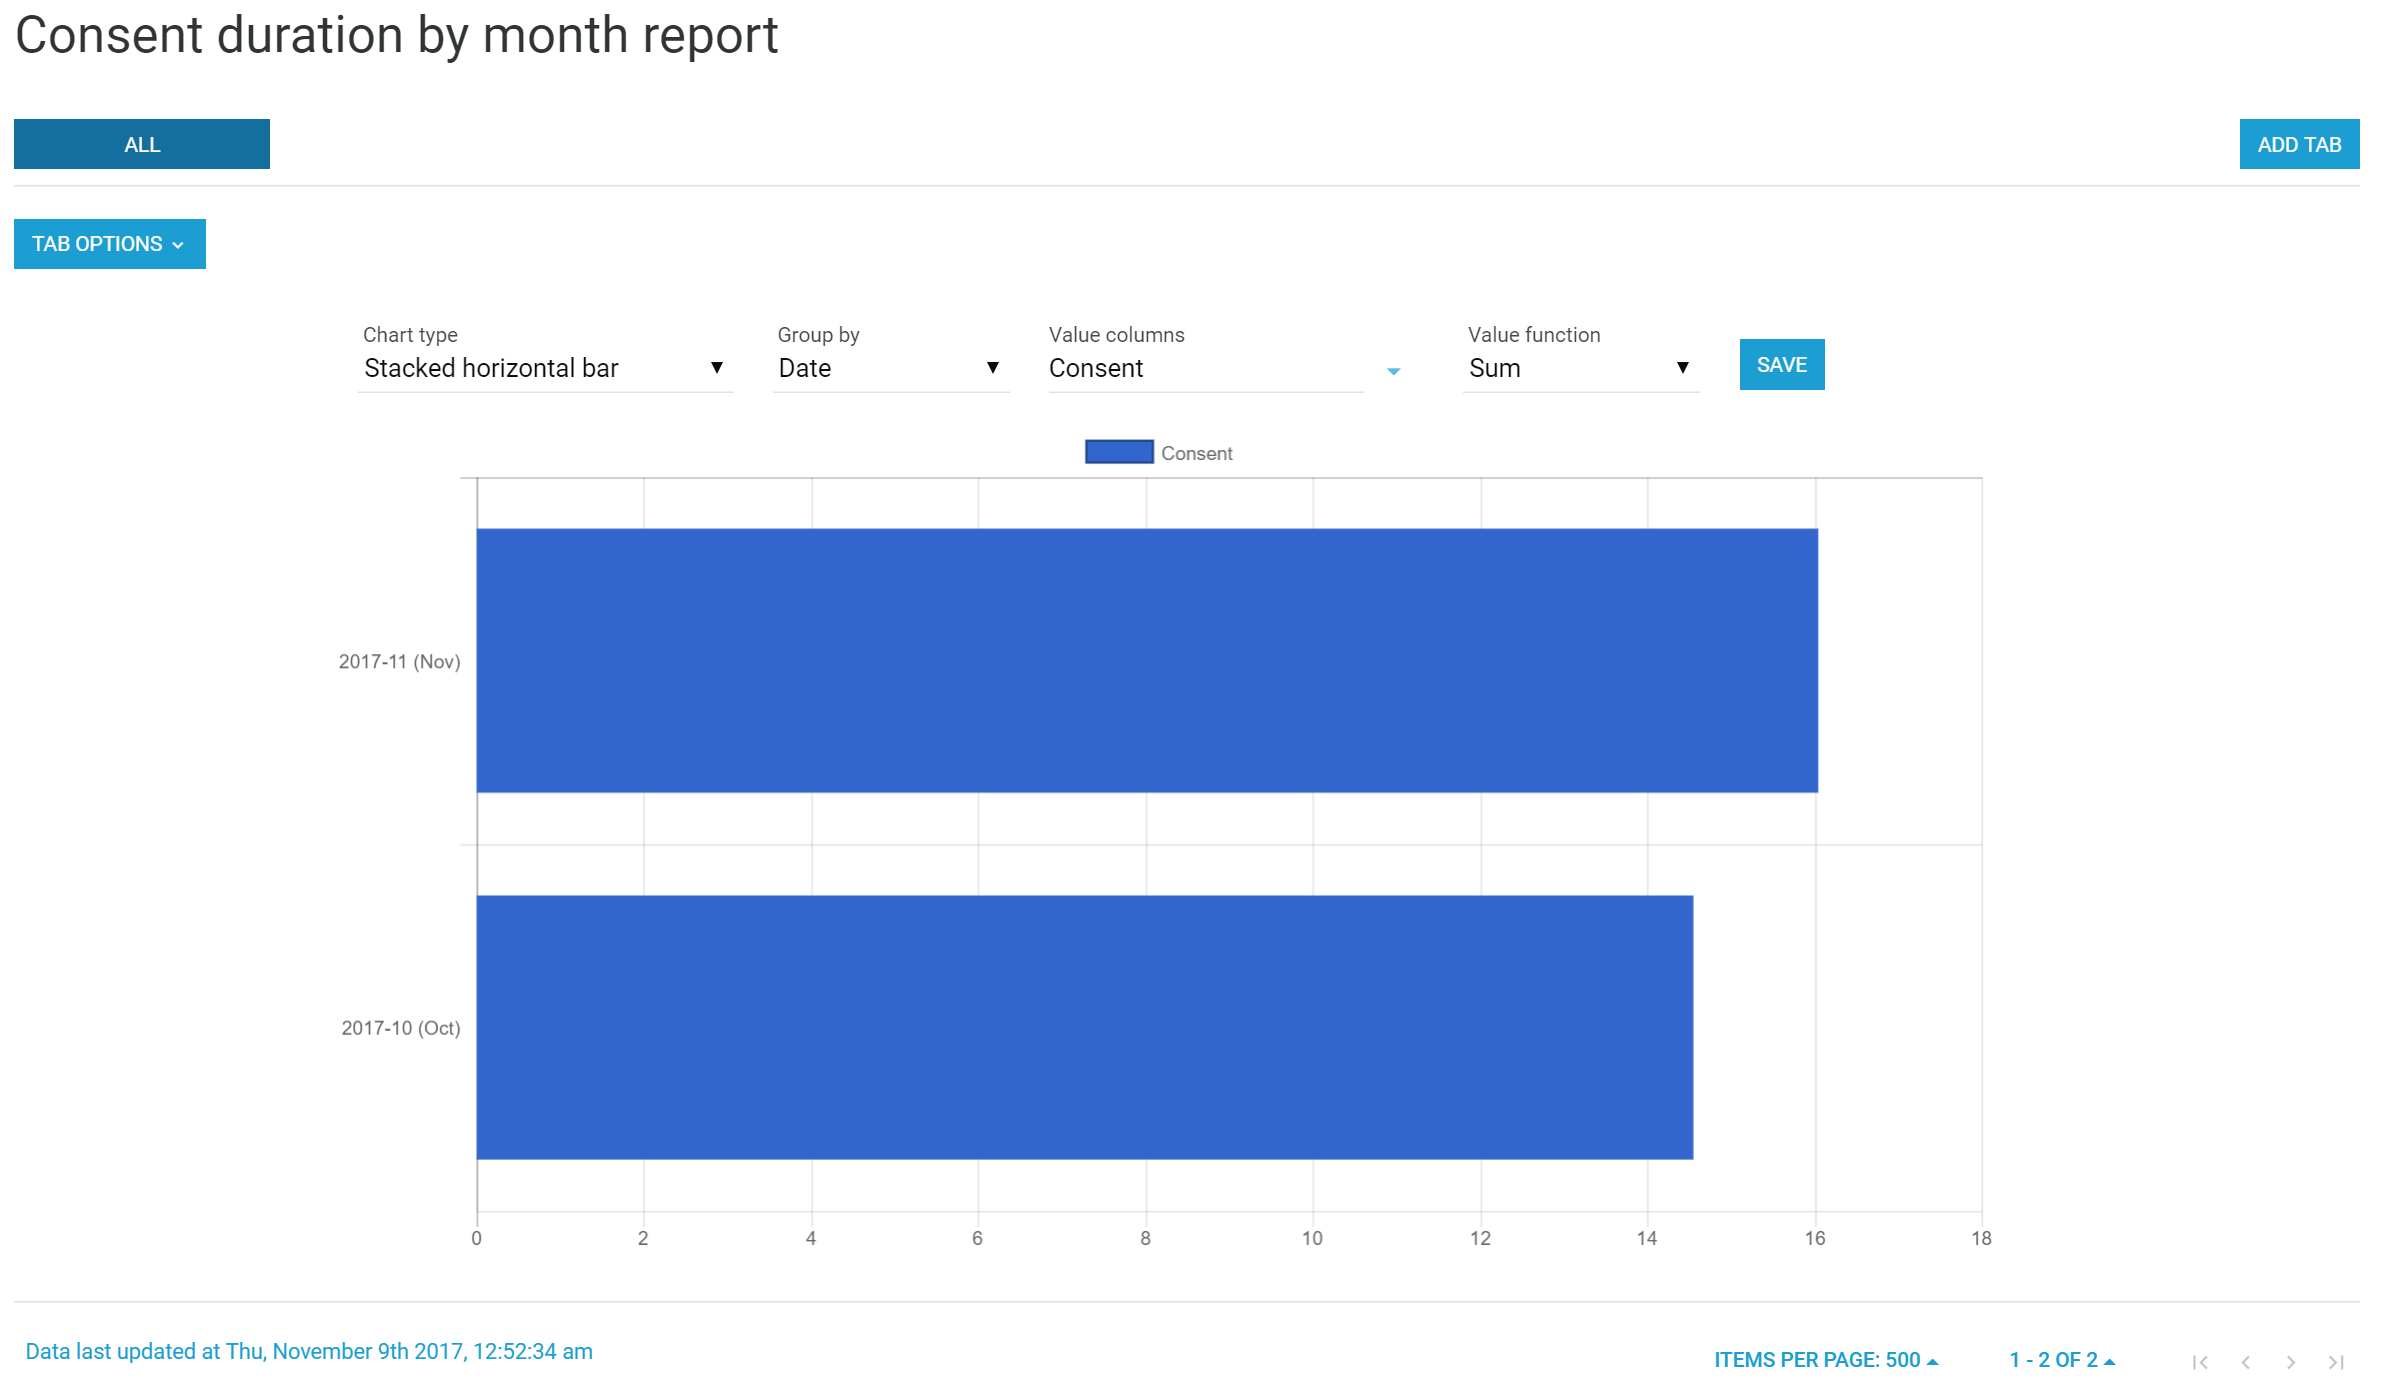
- Overdue: This preconfigured chart displays the number of consents in progress at the end of each month where the duration (with Road Manager) has exceeded the maximum duration available for consent (including any extensions of time) stacked by the amount of time overdue.
- Backlog: This preconfigured chart displays the number of consents in progress at the end of each month stacked by the amount of time remaining or time overdue.
- Select >By Day Report
- All: This preconfigured chart displays the number of consents in progress (backlog) at the end of each day (or month to date for the current month) stacked by overdue and not overdue.
- The blue component 'Not overdue' displays the number of consents in progress where the duration (with Road Manager) has not exceeded the maximum duration available for consent (including any extensions of time).
- The red component 'Overdue' displays the number of consents in progress at the end of each day where the duration (with Road Manager) has exceeded the maximum duration available for consent (including any extensions of time).
- Overdue: This preconfigured chart displays the number of consents in progress at the end of each day where the duration (with Road Manager) has exceeded the maximum duration available for consent (including any extensions of time) stacked by the amount of time overdue.
- Backlog: This preconfigured chart displays the number of consents in progress at the end of each month stacked by the amount of time remaining or time overdue.
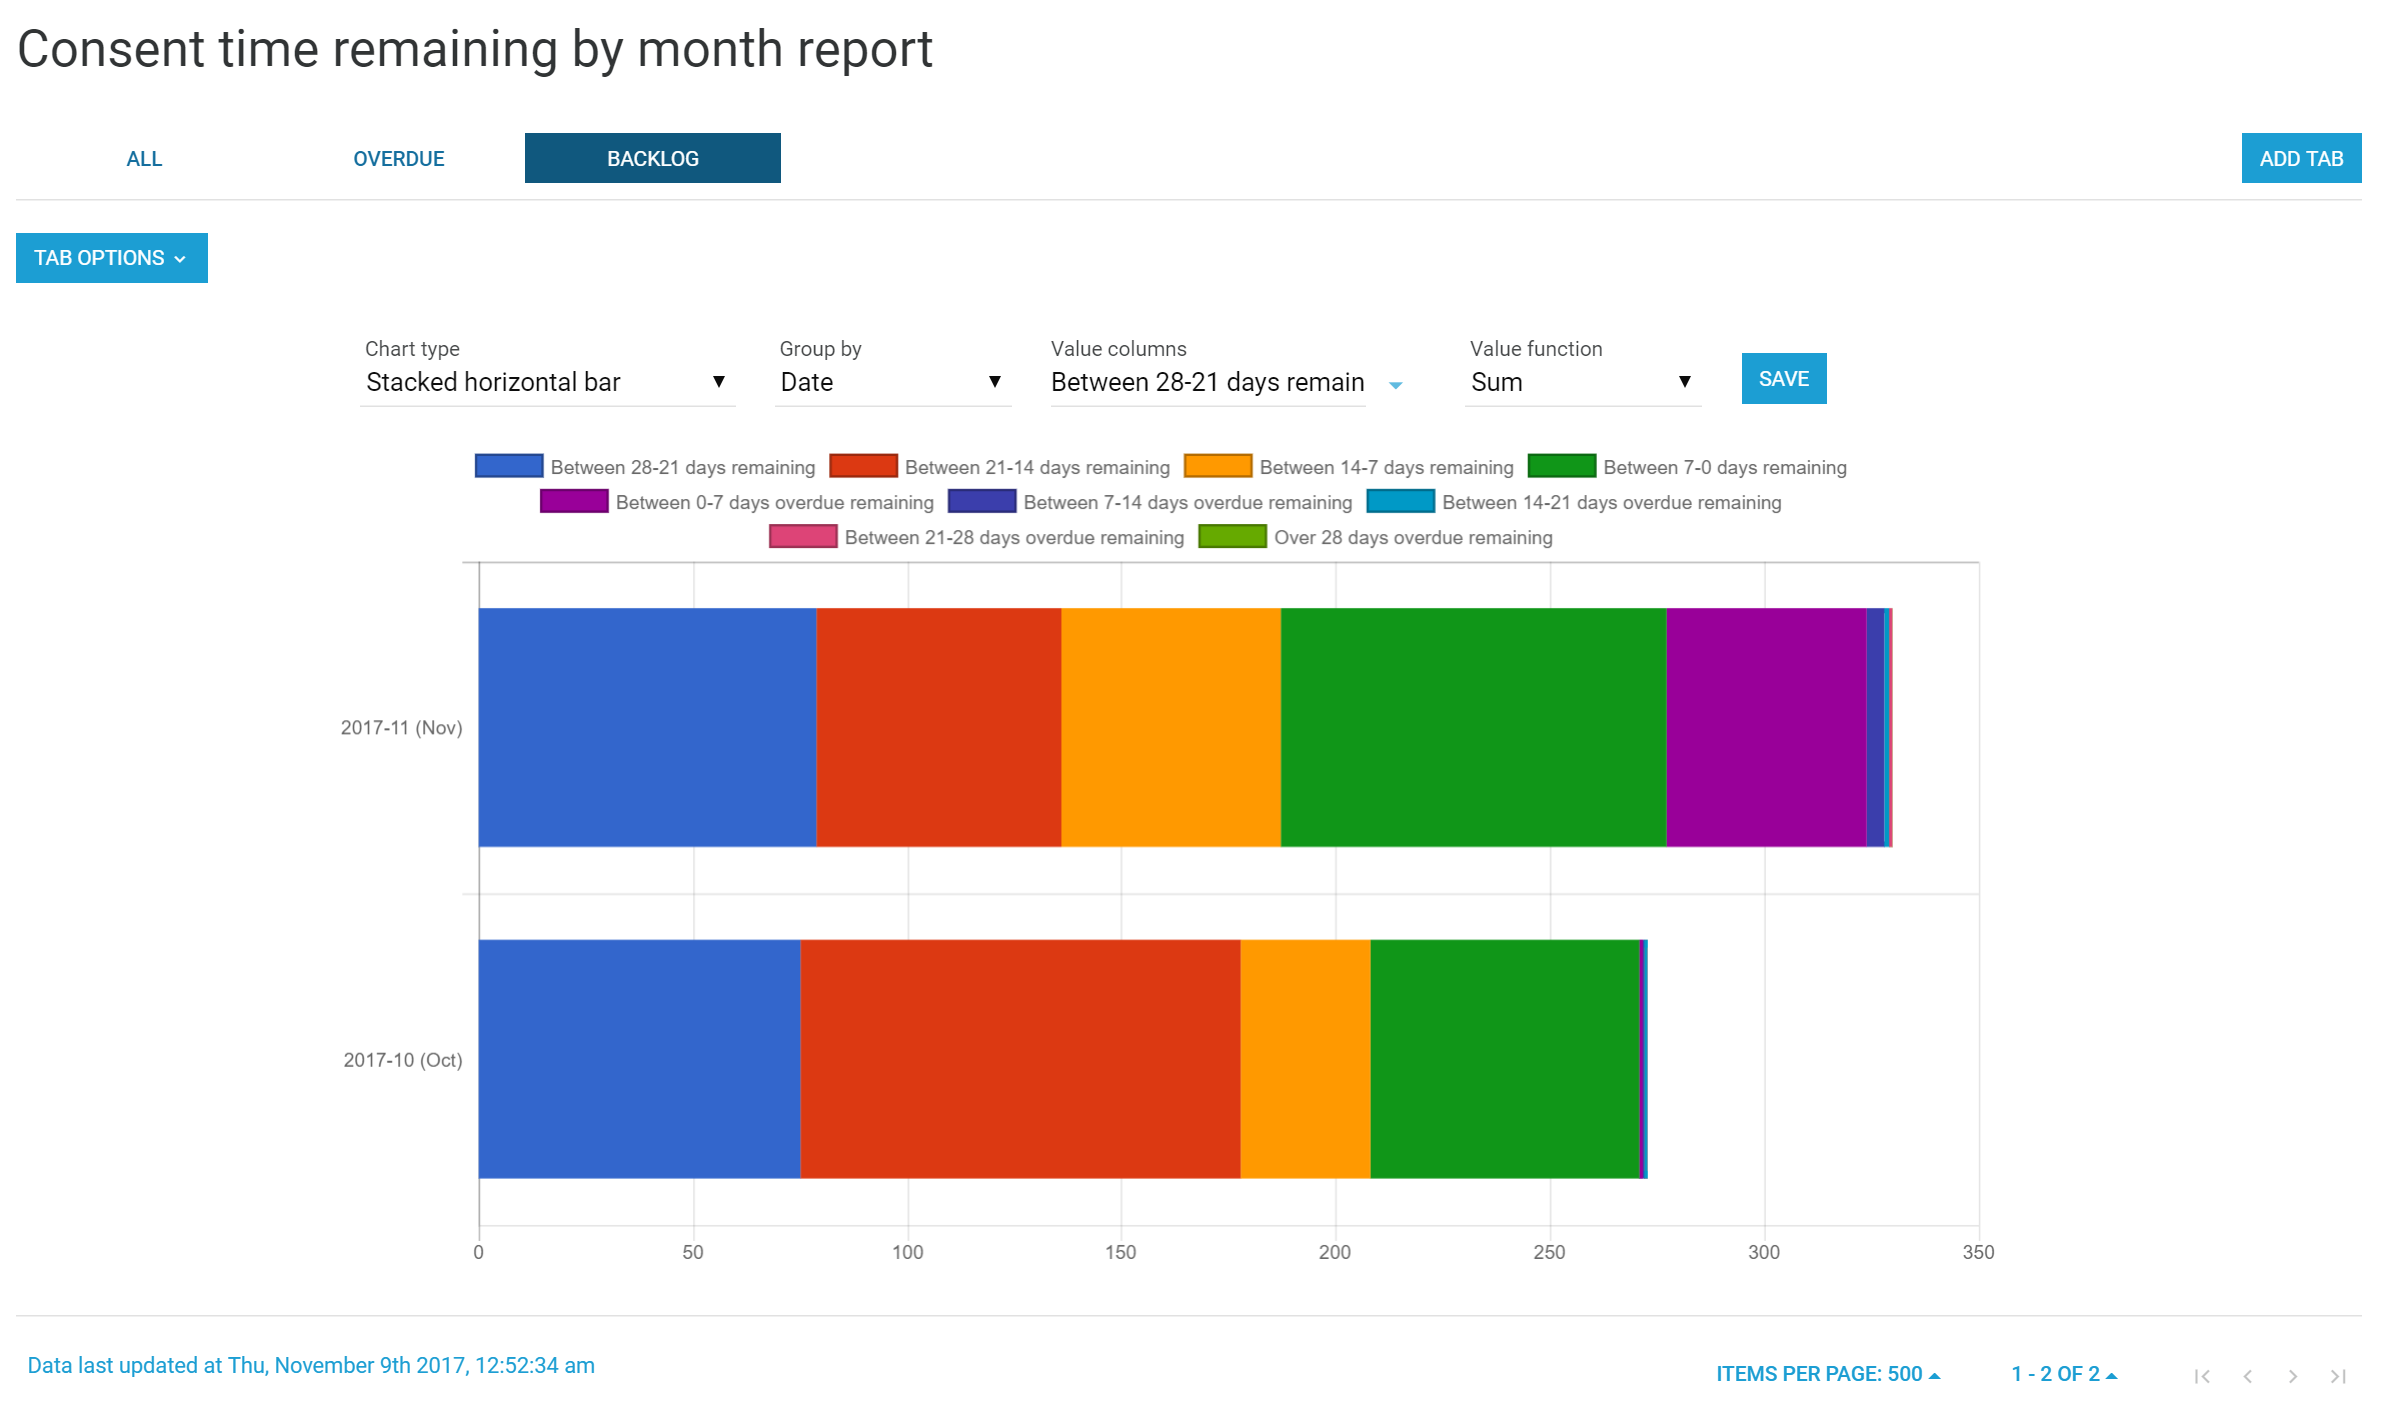 Image Added Image Added
Add TABS and change column values using the drop down list to change values and filters. |